APPENDIX: 3D animations of hypocentre time plot
of Fig. 9 in Tsunoda et al.(2013) Thermal energy transmigration and fluctuation.
NCGT Journal, 1, 2, 65-80.
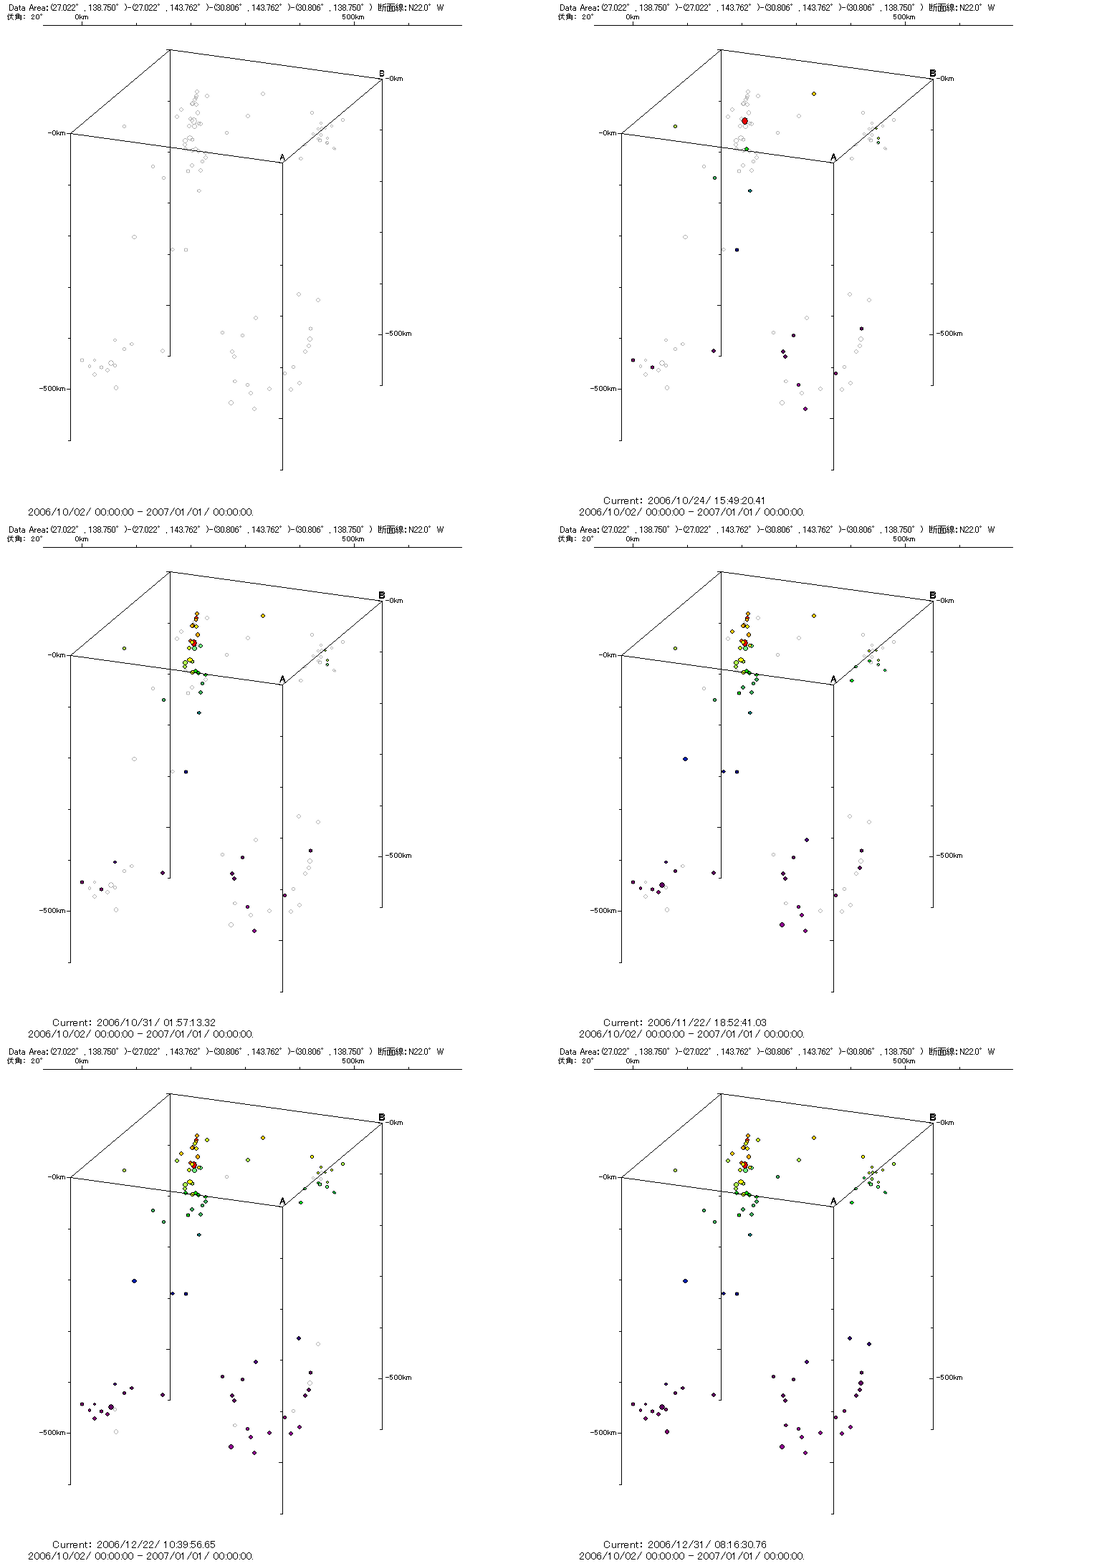
3-D animations of hypocentre time plot
during 02/Oct/2006 to 01/Jan/2007
along the N72E line in Torishima, Izu Island chain.
-- Click each image to enlarge.--

Fig. 9-a Loccality map of plot area. Mase map is from http://www.gsi.go.jp/atlas/archive/j-atras-d_j_08.pdf

Fig. 9-b Plan view animation of time plot.

Fig. 9-c 3-D animations of hypocentre time plot.

Fig. 9-d Time-Depth plot.

Fig. 9-e 3-D animation of time plot
viewing from North-northwest.

Fig. 9-e 3-D animation of time plot
viewing from West-southwest.
|

